


Learning to Trust FIP
Old habits are hard to break, whether it's evaluating a pitcher by ERA or putting down the Pall Malls.

Most baseball fans know what ERA and FIP stand for, but I mistakenly assumed everyone who reads these pages knows all the newer stats/metrics.
I’m pretty good at finding out what the various acronyms mean when I’ve read or heard a term I’m not familiar with, but not everyone is, so I’m going to include the definitions (and editorial comments) from Fangraphs here.
Earned Run Average (ERA) is a rudimentary metric designed to assess how well a pitcher has prevented runs in the past. Given that a pitcher’s job is to aid in the prevention of run-scoring, ERA is understandably a popular and widely used statistic. ERA is perhaps the most commonly cited pitching statistic at large, but has a number of serious flaws that should lead you to use it sparingly.
A statistic that estimates a pitcher’s run prevention independent of the performance of their defense. FIP is based on outcomes that do not involve defense; strikeouts, walks, hit-by-pitches, and home runs allowed.
In short, ERA is from the Stone Age like me and FIP is newer and cooler, not to mention more accurate, per FanGraphs.
Snark aside, this makes sense intuitively.
There are no errors or bad hops on strikeouts and there is no defense against a walk.
Old habits are hard to break, whether it’s baseball or lighting up Pall Mall’s, and despite having more accurate measures available, ERA is still widely used and I’m one of the guilty.
Despite constant use and writing about advanced statistics, I struggle using some of them in day-to-day baseball discussions and writing.
I’ve battled with fWAR, and struggled with xBA among others, but at least I’m trying.
It’s just hard for an old head like me when I see an easily caught soft line drive assigned an xBA of .680 or something.
Back to FIP.
For this exercise, I wanted to see if FIP made sense, if what I was seeing and processing with my brain aligned with what FIP said “should” have happened.
I chose to do this by using the E-F stat on FanGraphs.
E-F (ERA-FIP Differential): The difference between the pitcher’s ERA and FIP.
Theoretically, this will tell us if a pitcher was lucky or unlucky and will hint at the direction, positive or negative, regression is likely to appear in the future.
A positive E-F value suggests a pitcher is allowing more runs than expected based on their strikeouts, walks, and home runs and maybe his defense isn’t supporting him as well as they could or luck has gone against him.
A negative E-F value suggests that a pitcher's defense may be helping more than average, or he’s been lucky somehow.
In 2024, the league FIP was 4.08, as was the league xFIP and ERA.
I split the Astros pitchers into three categories—Rotation, Bullpen, and Injured—and will examine the E-F numbers for each.
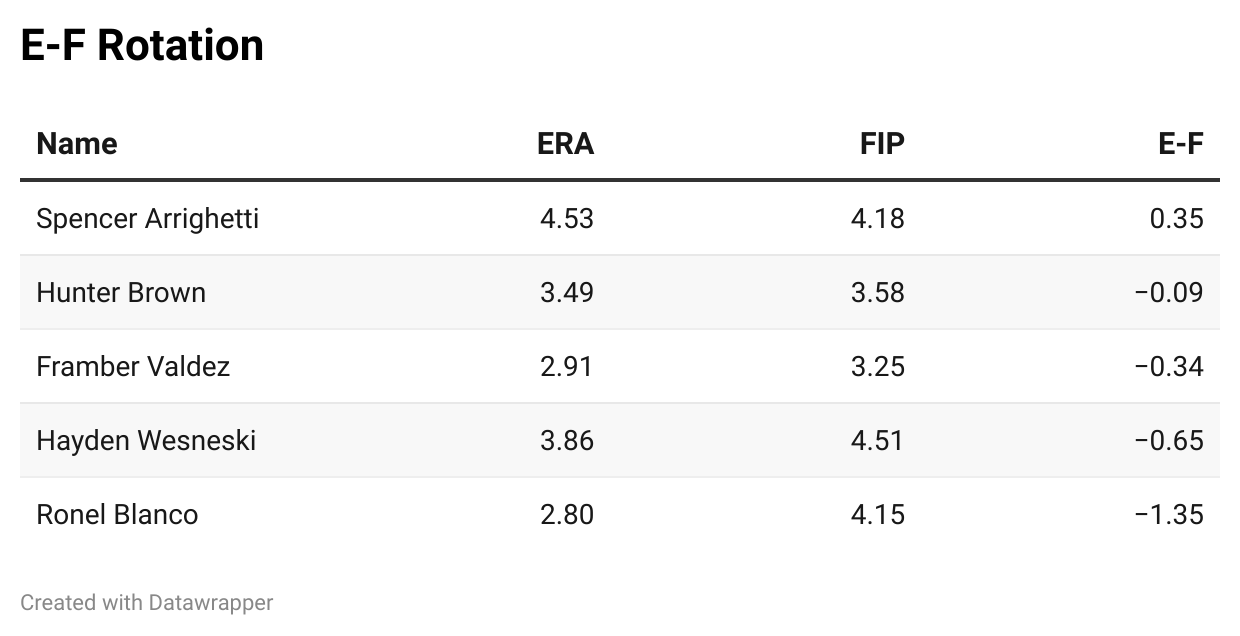
With only Spencer Arrighetti in the positive range, this portends regression ahead for the rotation in general, particularly for Ronel Blanco, which is a familiar theme.
Blanco’s xERA was 4.00, much closer to his FIP than his actual ERA of 2.80.
Together these two metrics point to Blanco being lucky in 2024 and closer to a 4.00-4.15 FIP pitcher than his 2.80 ERA might indicate.
Additional numbers back up this theory such as Blanco having a BABIP of .220 last season when the league was at .291.
Every projection system available on FanGraphs projects Blanco’s 2025 BABIP to be between .265 and .292, so you can see why regression is projected.
Similarly, Blanco’s xFIP projections are in the mid-4’s with a high of 4.85.
This would also suggest that Arrighetti was much closer to Blanco than the traditional stats indicate. I can’t say that’s something I picked up on in my viewing, but I do think Arrighetti had his moments.
Hayden Wesneski also has a fair amount of regression ahead according to FIP, and if he finished with a FIP of 4.51, I frankly would be disappointed.
My head says: Improvement from Arrighetti, status quo from Brown and Valdez and regression from Blanco, but not 1.35 points.
I haven’t seen Wesneski enough to form an opinion, but other numbers indicate he could be better than expected.
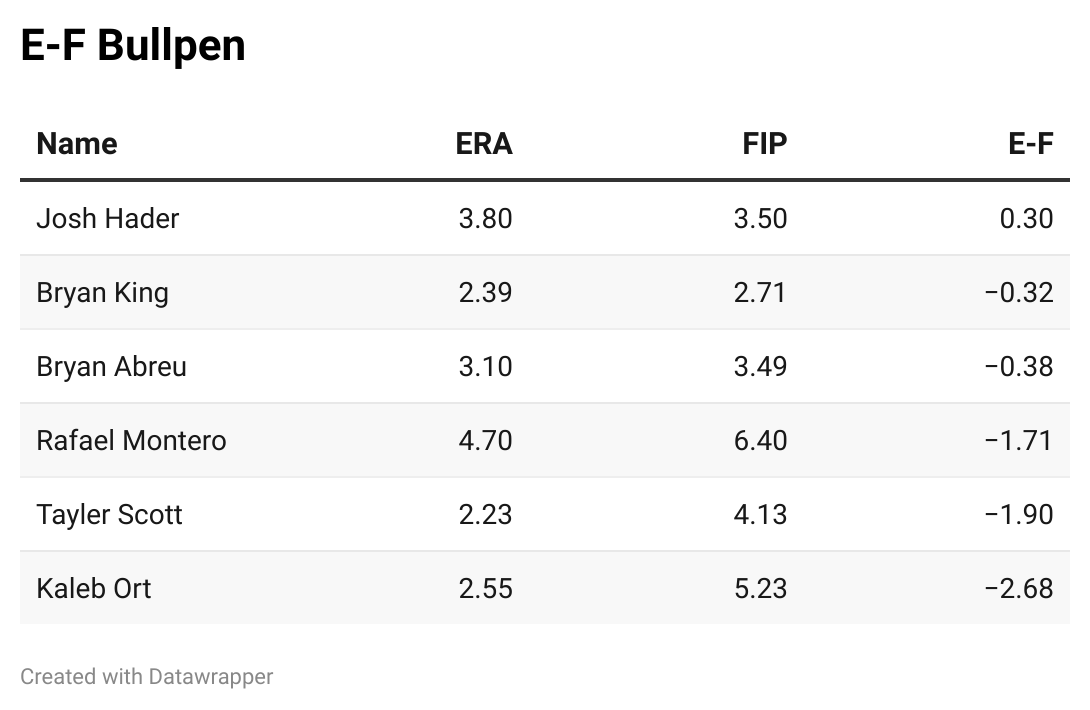
Seeing Josh Hader in the positive on this statistic is another hint that things weren’t as bad as they may have seemed last season.
I would expect some regression from King, who I like, mainly because he had a 2.39 ERA last season.
There I go reverting to the Stone Aged ERA number. King’s sample size was small, so the variance is potentially large, but if King ends 2025 with a 2.71 FIP that’s a good thing.
Abreu is an interesting case in that his increased role will bring increased scrutiny. He teeters between genius and disaster almost every outing and one bad one could damage his numbers for a long time, if not the entire season.
Tayler Scott is another interesting case. For all he gave the Astros last season, Scott registered a 0.2 fWAR and there was some good defense and/or luck behind him.
It was always likely that Scott would have trouble duplicating his 2024 success because he’d never done it before, but this shows you just how far the fall could be.
Similar to King, I liked Kaleb Ort in a small sample size, but recognize that would be harder to do over a season as these numbers indicate.
My head largely agrees with these numbers and conclusions, especially for Scott, though much like with Blanco I would expect a smaller regression than indicated, but in full transparency that could be the Astros fan in me.
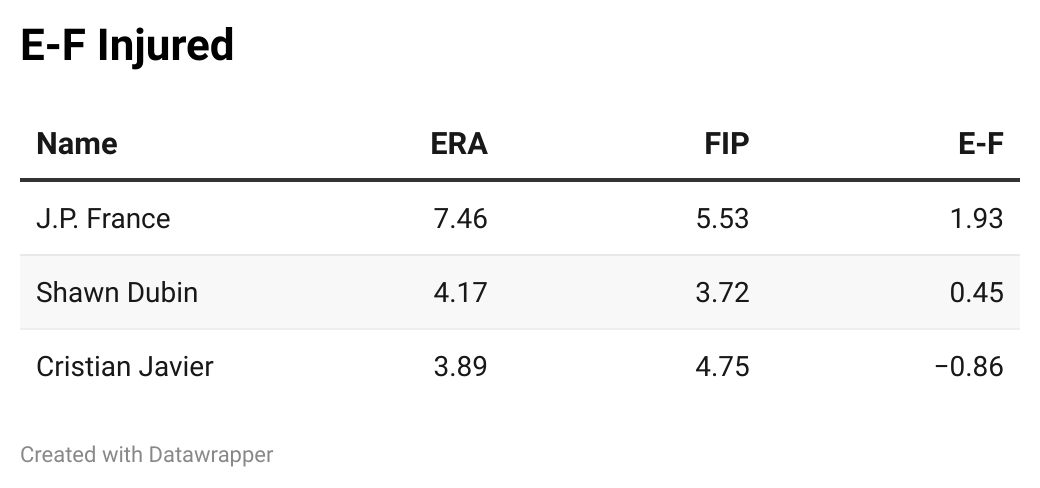
Not much on the injured guys, except Dubin was underrated in my opinion and is a valuable piece of the bullpen, as Seth Martinez was before him.
Modern-day baseball bullpenning can be about eating innings and Dubin was solid for most of the season in that regard.
Use of FIP Moving Forward
Overall I like the FIP metric as it makes sense both intuitively and in practice, at least for the 2024 numbers.
I do question the amount of regression theoretically in store for Blanco and Scott, but the concepts and applicability make sense.
I have to keep telling myself those are just two pitchers in the big world of MLB pitchers and there are always outliers and weird results, no matter the metric.
I plan to incorporate some version, either FIP, E-F or both into the metrics I share moving forward.