Projected Win Total
One of the most accurate stats I've developed
One of the focuses of this site is to provide the reader with information they won’t find anywhere else.
That’s a tough ask in 2024 given sites like fangraphs, baseball-reference and baseball savant.
Sometimes this desire to be different manifests itself as something completely new and sometimes it’s a different take on a familiar metric.
Admittedly, I’m hit or miss with some of these and in the coming season plan to address that by a) expanding content b) trying new things and c) placing less emphasis on the things that don’t work.
The “projections” portion of astrosprojections served its purpose last season, but wasn’t great. We’ll do it again this season, but it’s far from perfect, as are the various other projection models.
I still find it valuable in checking biases, my own included, when fans believe numbers are always going to go “up and to the right” or someone believes Yuli is going to hit .310 because that’s what he did in Cuba 15 years ago.
Think of these as a reality check when things are going either really good or really bad.
More on those as we get closer to the season.
One thing we do well is the projected standings and projected wins.
Over the years, I’ve developed a system that appears to work better than the Pythagorean Theorem model (“Pythag”).
The model takes into account actual wins and losses, unlike Pythag which only includes runs scored and runs given up.
What I’ve found is, in some cases that matters.
Here’s an accounting of how the system compared to the Pythag in 2023.
The results are clear, but here are a few notes:
Exact match: AP 8 Pythagorean 5
Closer to the actual number of wins head-to-head: 23-0-7 in favor of AP.
Total Games off (either way): Pythagorean 107 AP 53
AP Summary
8 teams with 0 game difference
7 teams with 1 game difference (either way)
6 teams with 2 game difference (either way)
I was also curious how the system did month by month for the Astros, with the ebbs and flows of a 162 games season.
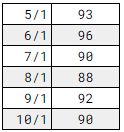
I went back and looked at the first of every month (March and April were combined) for the projected wins for Houston.
The Astros projected wins fluctuated between 88 and 96 and from July 1 on it was within 2 games either way.
Not bad.
Dropping from 96 to 90 makes sense after a 13-14 June, but what about Houston going 15-10 in July and still dropping two additional games?
It turns out that despite being 5 games over .500 for July the Astros run differential was only +1.
The point for me is that as early as July 1, we knew what the team was, more or less - between 88 and 92 wins and it turned out the final total was right in the middle (probably just luck).
Will we be able to do the same exercise in 2024?
I don’t know.
When they woke up on July 1 the Astros had 82 games under their belt, Altuve had been back for a little over a month (with an IL stint coming up) and J.P France was 7 or so starts in.
They were 45-37 and would go a remarkably similar 45-35 from that point forward.
While we may not have such a narrow window of projected wins in 2024, I’m confident that the projected wins metric will be one of the most accurate when all is said and done and I plan to expand on the content around it this season.
Thanks for reading!


