If you followed during the 2023 season you may recall that every game day I posted a chart of bullpen usage by pitches for the preceding week to give readers an understanding of how often and how much each reliever was used.
That, of course, was a basic measure because not every pitch is the same, requires the same effort, both physically and mentally, and therefore 20 pitches for Bennett Sousa does not necessarily equal 20 pitches from Bryan Abreu or Ryan Pressly.
Like everything else in baseball, it depends.
One way to measure stress is to use the Average Leverage Index found in a baseball-reference.com box score.
For example, last opening day Framber Valdez had an aLI of 1.27 for 85 pitches, while Hector Neris had 2.81 for his 17 pitches.
This is an estimate, but if we assume the stress of the average pitch Valdez threw was 27% above average, then those 85 pitches should be considered some number higher than 85.
What’s that number? I don’t know, but 85 x 1.27 = 107.95 and I’m positing that is closer to the stress that Valdez’s arm faced that day and why he was removed after “85 pitches and 5 innings”.
Similarly, in a vacuum, the 17 pitches that Neris threw would make it seem like he could turn around and pitch the next day, but when you complete the same exercise those 17 pitches are closer to 47.77 due to the stress of the game situations Neris faced.
Could that be part of why the Astros went to Seth Martinez down a run in the top of the 7th inning in game 2 of the season the next day?
Who knows?
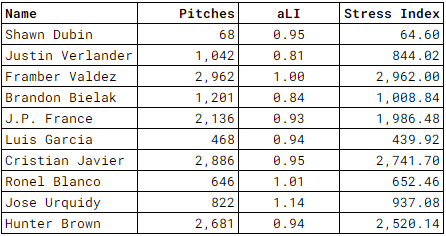
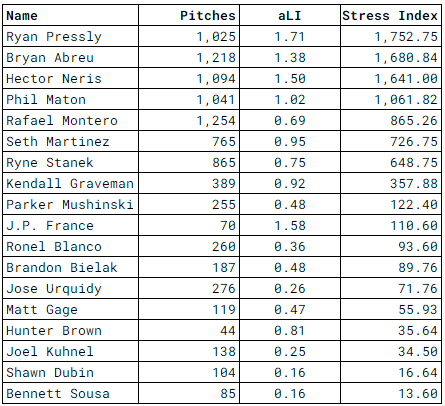
Below are the season numbers for both starters and relievers. Starters generally face much lower stress on average than relievers, with the exception typically being the “innings eaters” out of the bullpen who generally enter when the game has been decided.
For example, notice the difference between J.P. France’s aLI as a starter (0.93) and as a reliever (1.58) (small sample size caveat).
Another example is the contrast between Brandon Bielak (as a starter) and Bryan Abreu, who threw almost the same number of pitches.
Despite the similarity in the number of pitches, Abreu’s cumulative season Stress Index was 66.6% higher than Bielak’s.
Bielak is starting games with no one on base and generally, in innings one through five, while Abreu became the 8th inning guy, often with the game on the line.
There are several different ways this data can be used, the most obvious being the two examples above: (1) When is it time to remove the starter even if he’s not at the "magic” 100 pitches and (2) “Why is a reliever not available despite throwing only X number of pitches in the previous game.”
I’m sure other ways will come to mind, too as the 2024 season develops and this data is tracked.
It’ll be fun to see what (if any) trends develop.
Thanks for reading!


