Updated Projections - 25 of 162
Subscriber Appreciation Post - Projected standings for all divisions, luck rankings, Game Scores and more
Something a little different today. Yes, as always, I’ll start out with the projections, but as a thank you to the subscribers, I’ll at some additional things I track.
Appreciate every single one of you.
Composition of Projections:
2023 Actuals: 15.4%
Preseason Projections: 84.6%
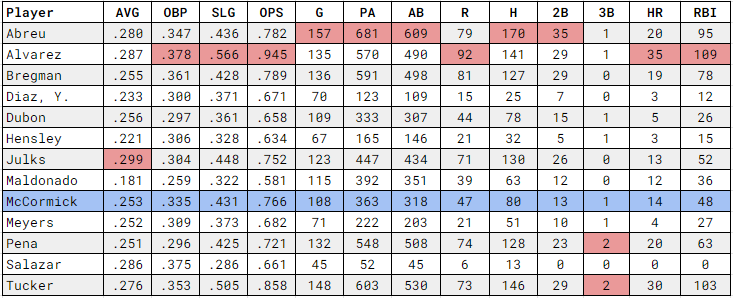
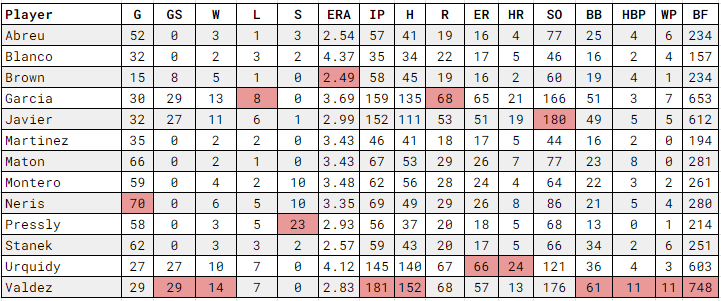
Season Projections
Not playing in Tampa has begun to hurt Alvarez’s season-long projections.
Hunter Brown has been phenomenal and he becomes the first MLB pitcher in 2023 to have 3 games of 7 innings with 0 ER allowed.
Obviously, the numbers below will increase with each start.
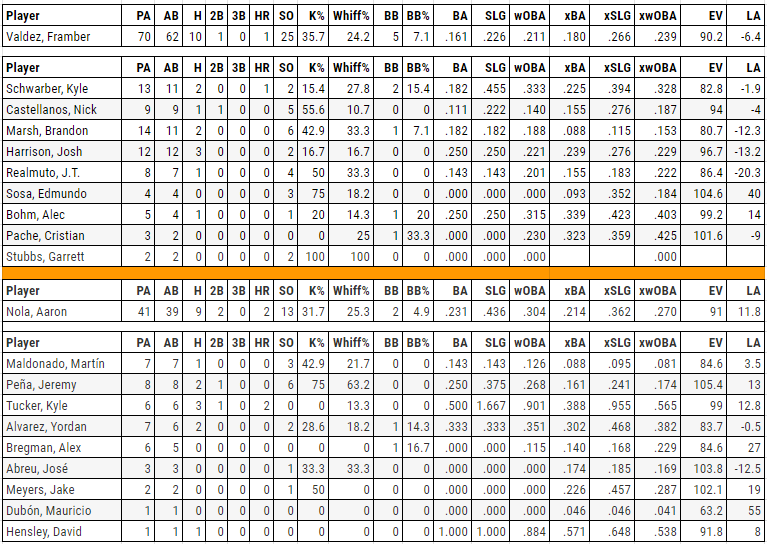
Today’s Pitching Matchup
What a great matchup this could turn out to be.
Bullpen Usage
Thursdays off are a huge boost as the Astros should come back with a full complement against the Phillies.
Pressly was used on consecutive days for the second time this season on Tuesday and Wednesday.
Here’s the number of times each reliever has been used on consecutive days.
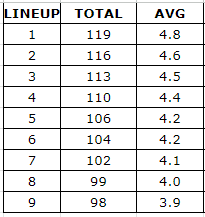
Lineup Ramifications
Managers often talk about moving guys up in the lineup to get them more at-bats. Does it make a difference? You bet. Not so much if you move a spot or two. But moving Jeremy Pena from lead-off to sixth, for example, might mean 90 fewer at-bats over 150 or so games.
Game Scores
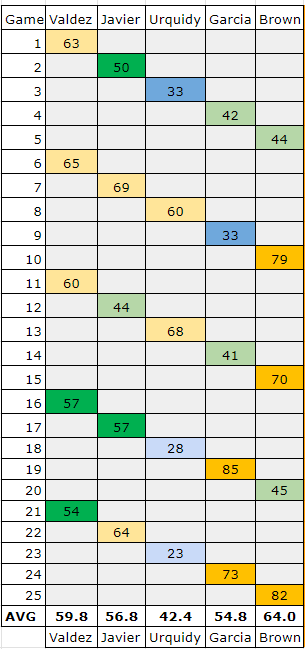
By almost any measure Hunter Brown has been the best starter 5 times through the rotation.
Here are the Game Scores (via fangraphs) for each of the first 25 starts and each starter’s average score.
0-10 Unspeakable |10-20 Awful | 20-30 Bad | 30-40 Poor
40-50 Below Average | 50-60 Above Average | 60-70 Good
70-80 Great | 80-90 Excellent
K Prop
I’ve got Framber at 8.08 and the market is showing 6.5. Easy over.
Odds
The Astros are -144. If you can stomach it, the Astros are +146 at -1.5. Why chance it? The difference in the payout is $66.67 at -144 and $146.00 at +146. Houston has only played 4 one-run games out of 25. If the Astros win, odds are they will do so by more than one run.
Projected Standings and Luck Rankings
These are still a little weird - the Rays aren’t going to win 131 games, but by June 1 they should provide a better gauge of the season ahead.
I created the formula behind these rankings when I got frustrated with FanGraphs projections a few years back.
These aren’t predictions. They are closer to “if they continue to play the way they’ve played…”
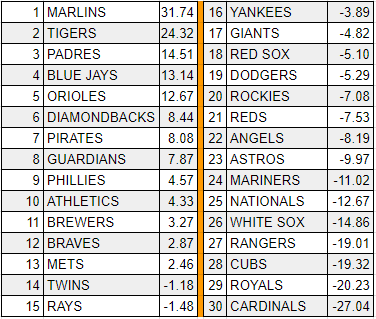
The Luck Rankings below are one of my favorites. In a perfect world, it tells you which teams are likely to regress (or progress), with 0 being “Your record reflects how you’ve played”.
The number is intended to show the difference (percentage) between a team’s actual winning percentage and expected winning percentage.
The more positive the number the luckier a team has been. The more negative the number the more unlucky you’ve been.
The Marlins are a great example. How exactly is a 13-13 team the luckiest MLB team? They’re 7-0 in one-run games (1-1 in extras) and for a team that has been outscored by 38 runs in 26 games, they’re “lucky” to be 13-13.
One-run games are a zero-sum endeavor. One team wins and one team loses and in the long term, a team will trend towards 50% wins and 50% losses in one-run games.
In other words, the Marlins could easily be 9-17 and that’s how they’ve played so far.
It’ll be fun to track this team from this point forward and see how my theory pans out.
It’s weird that 4 AL West teams are in the bottom 9 in luck. This also shows you the A’s aren’t unlucky, they’re just bad.
I used these rankings from last year to write this and so far, I’m 2 for 3.
May not mean anything note of the day
Hunter Brown has given up 0 home runs in 50.2 MLB innings pitched.
Astros 162
Click on the image for Episode 25.
Thanks for reading!


