Composition of Projections:
2023 Actuals: 38.9%
Preseason Projections: 61.1%
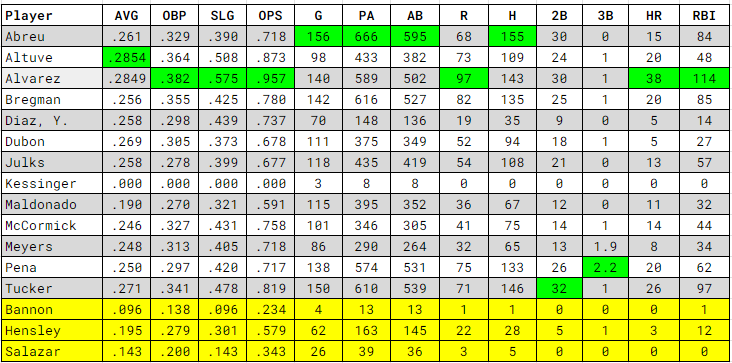
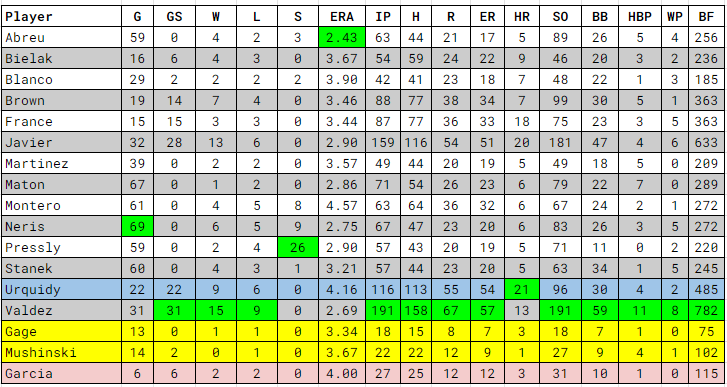
Season Projections
4 hits. 5 hits. 6 hits. 3 losses. The offense has been putrid and who knows if and for how long Yordan may sit.
Framber’s loss of composure - I’m not talking about giving up 3 runs, that happens - was a little surprising.
Astros 162
Click on the image for Episode 63.
Bullpen Usage
With 3 games to go until a day off, the bullpen looks to be in decent shape, though Abreu has gone back-to-back for the fourth time this season.
Today’s Pitching Matchup
Logan Allen is having a good season but has never faced any Astro.
K Prop
Surprised that the number is only 4.5 for Javier as my number is a hair over 6. Over.
Odds
The Astros are -112, but no Yordan makes this tricky. I’ll still take the Astros and while I’m tempted to go run line at +142, with this offense that’s too risky, especially if Yordan sits.
Projected Standings
Decided to get a little crazy and do all of MLB and Luck Rankings.
Luck Rankings
Think of the number beside each team as the percentage of their winning percentage that is based on “luck”.
Using the Rays as an example, 2.02% of their .708 actual winning percentage is luck. That’s not much and pretty solid.
The Marlins on the other hand have been the luckiest team pretty much all season due to their winning a crazy amount of one-run games (16-4) and 17.34% of their winning percentage of .556 can be attributed to luck. By the Pythagorean Theorem you would expect the Marlins to be 29-34 and 6 of their 35 wins can be attributed to luck.
Positive numbers mean the team has been lucky, 0 is neutral and negative is unlucky.
May not mean anything note of the day
After 63 games in 2023 Astros are slashing .246/.315/.398, wOBA .312 wRC+ 99.
After 63 games in 2022 Astros were slashing .237/.315/.409 wOBA .315 wRC+ 108.
Surprised at how close most of the numbers are AND the average is 9 points higher this season.
Thanks for reading!


