Updated Projections - Game 162 of 162
Champions
Composition of Projections:
2023 Actuals: 100.0%
Preseason Projections: 0.0%
Season Projections
We’ve come to the part of the season where my preseason projections mean 0. Literally. Some may argue that was the case all along.
That said, they did work as designed with the ACTUAL numbers becoming a larger and larger part of the ongoing projections until they = 100% after game 162. In that sense, they “worked”.
The plan is to do a postmortem in the offseason, but just a guess…projections for guys with little to no MLB experience like Yainer Diaz and Hunter Brown were way off, while projections for established players with history were closer.
In the end, at least part of the goal was to help fans not overreact one way or another.
For example, I was consistently showing Jose Abreu in the mid-80s in RBI when he was in his funk during the first part of the season, because his history said that’s what he was going to do, and he eventually surpassed even that with a great September RBI-wise.
On the other hand, I projected 23 HR preseason and I knew fairly early that wasn’t going to happen, as on May 1 my new projection was 19, one more than he totalled.
My model was still off on his average and slugging, but as early as July 1 it pegged him to finish with 17 HR and 90 RBI, which isn’t bad.
Bullpen Usage
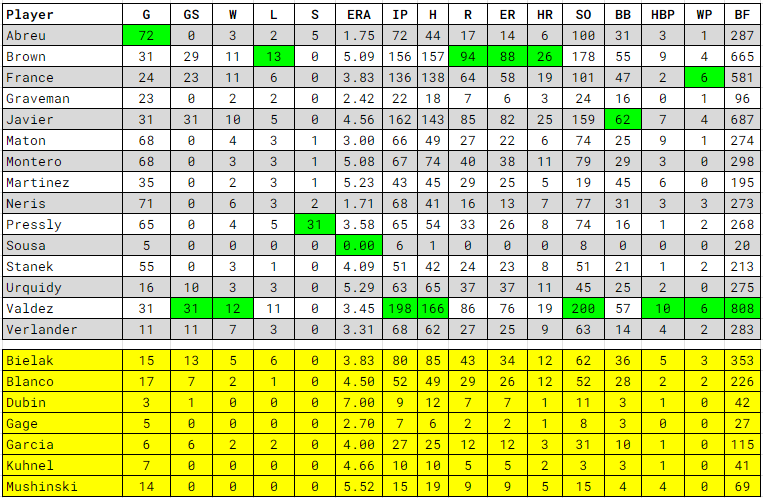
We’ll reset this for Saturday’s game, but here is the final week of the season.
Today’s Pitching Matchup
TBD.
Projected Standings
This is my pride and joy of my models. This model uses a weighted combination of run differential, actual win/loss percentage and “luck” (see rankings below) to project wins.
It is NOT forward-looking, but rather looks at how a team has played and says if they continue at this rate they will win “X” games.
In my opinion, it’s superior to Pythagorean because it takes into account actual wins and losses and luck.
Look no further than the Astros for an example. Pythag expected 93 wins on run differential, my raw formula expected 91.67 and when you add actual results it took them down to 90.
Three wins, or even 1.33 (the difference between Pythag and my raw number) doesn’t seem like a lot, but as we found out this season, it can mean a division title or not making the playoffs.
The point is, that the model comes closer to the actual number of wins than the Pythagorean Theorem does on a consistent basis.
Luck Rankings
There’s no mystery here. The number below is the percentage of a team’s winning percentage that can be attributed to luck.
Let’s use the Orioles as an example. Baltimore finished with 101 wins, but their run differential suggests they should have won 95.
What happened? Well, they were 30-16 in one-run games and 11-6 in extras.
If you deduct 7.26% off their .623 winning percentage it comes to .578, which equates to 93.6 wins, which matches my model’s raw number (not shown).
This is an interesting exercise to me because while some people believe teams can be very good in one-run games and extra-innings, there’s undoubtedly some luck involved.
My opinion is that both are part of the equation. We shouldn’t throw out the Marlins 33-14 record in one-run games, but we also shouldn’t expect them to continue winning them at that pace (.702) in the long run.
More than anything it’s another piece of information.
May not mean anything notes of the day
Jeremy Pena since July 6th:
309 PA .277/.343/.349 ISO .076 0 HR 20 RBI
Hit HR on July 5th, 0 since in 310 PA
Bryan Abreu since July 4th:
32 G 32 IP 15 H 1 R 1 ER 40 K 15 BB 1 HR 0.28 ERA
27 consecutive appearances without allowing a run
Bennett Sousa has retired 19 of the 20 batters he’s faced with 8 Ks and 0 BBs
August/September/Oct
Record: 30-25
Team ERA: 4.16 Starters ERA: 4.90 Relievers ERA: 3.00
Batters: .276/.352/.476 w/.356 wOBA 86 HR 128 wRC+
Thanks for reading!


Thanks for all of the work this regular season! These are such a treat and great perspective.