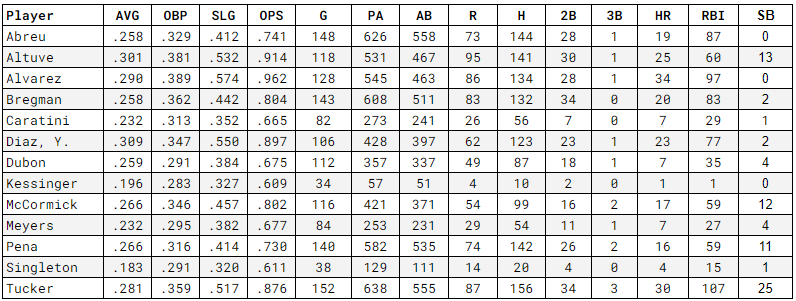
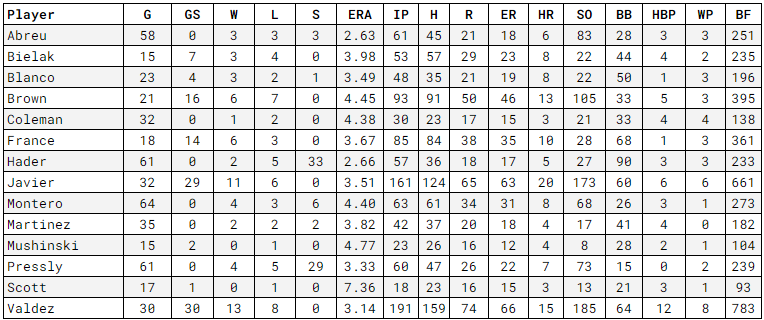
Composition of Projections:
2024 Actuals: 4.3%
Preseason Projections: 95.7%
Another good, but inefficient, game from the starting rotation.
Season Projections
Worth noting Jon Singleton has started 2 of the first 7 games of the season.
Also worth noting that designated starting center fielder Jake Meyers has started only 4 of the first 7 games and has only 13 plate appearances.
Tiny sample size and there certainly could be reasons, but not exactly what was verbalized during the offseason.
Dylan Coleman makes an appearance.
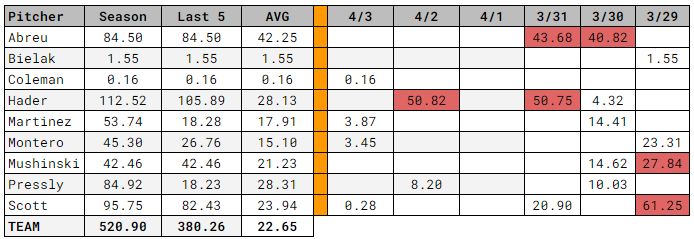
Stress Index
Bear with me on this as it’s a work in progress.
The goal is to capture the stress put on a pitcher, rather than just a number of pitches.
The calculation is really quite simple: Number of pitches x aLI, where aLI is the average leverage index.
5 innings of 1-hit, shutout ball from Javier, but very inefficient and inconsistent work and the second highest stress index (Valdez on opening day) of the young season for starters.
Very little bullpen stress as the Astros added runs. Likely going to need all hands on deck on Arlington.
Is it as simple as Coleman being optioned when France returns?
The Game Turned When
Bottom of the third, one out Yordan Alvarez homered (Fly), moving Astros win probability from 65.0% to 77.0%.
Projected Standings and Luck Rankings
Coming in the next few days as data becomes more reliable, but still getting crazy numbers.
More soon.
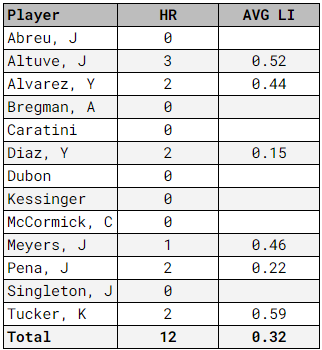
The Home Run Project
Yordan’s first home run had a leverage index of 0.72, but the rest were much lower because of the scores at the time.
The Grumpy Ump
NOTE: OVERALL FAVOR column is changed to reflect Astros only. In other words, a +0.24 in favor of Yankees is reflected as -0.24 here.
The umps continue to struggle calling strikes and go under 90% in Called Strike Accuracy for the 5th time in 7 games and are averaging only 87% accuracy.
The under has hit in 5 of 7 Astros games.
Information, except for O/U, courtesy of umpscorecards.com, just presented in a way that is easier for my brain to process.
Stat(s) of the Day
Houston starting pitchers vs. Toronto: 21.2 IP, 7 hits, 0 runs.
Houston’s rotation has a 1.29 ERA, the best in MLB.
Houston’s relievers have a 6.00 ERA, 23rd in MLB.
Houston’s batters lead the MLB with a wRC+ of 153.
Thanks for reading!


