A Note from the Publisher
We are in the process of rebranding to “Crawford Street Journal”. The reasons are simple. Thanks to our readers, what started as only “projections” for the season has grown into much more.
We’re still in the same place, or you can bookmark crawfordstreetjournal.com.
More to come.
Be sure to check out our new pages that are updated daily:
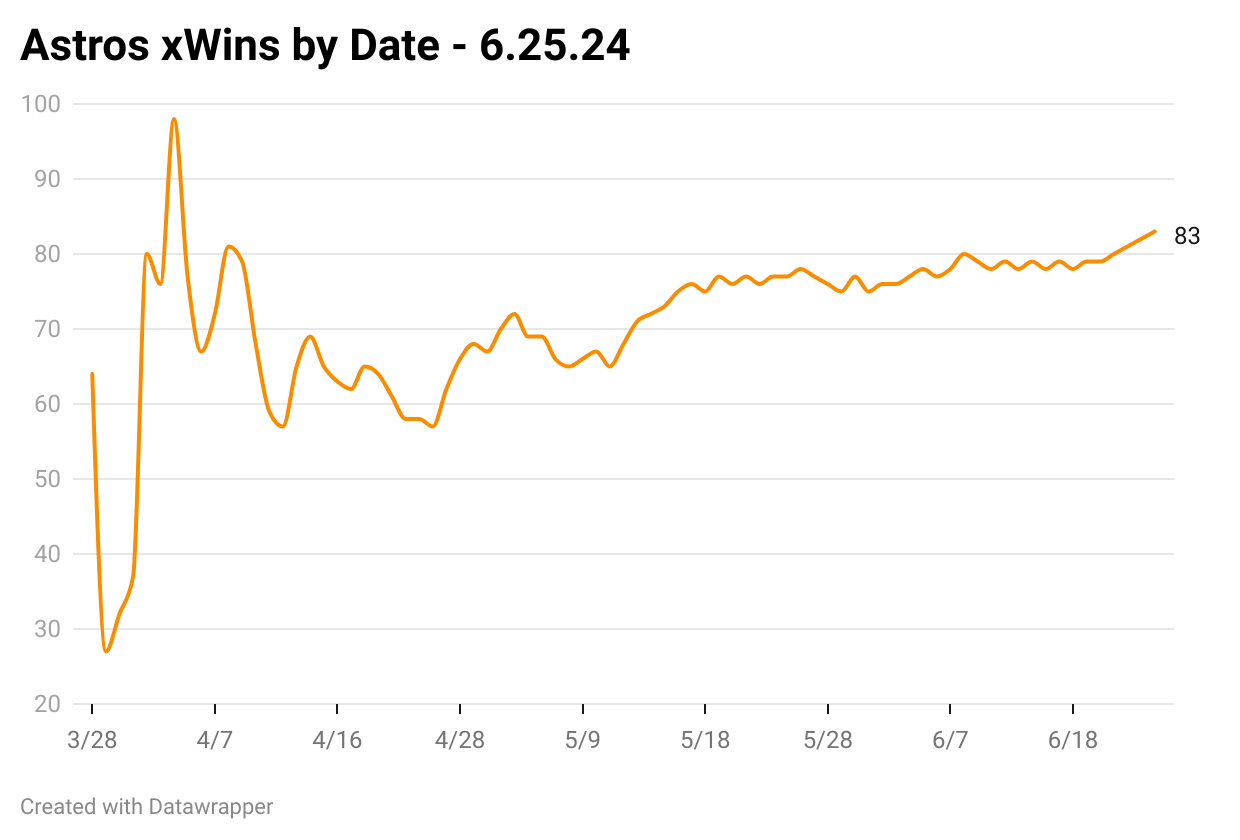
Astros Expected Wins | MLB Projected Standings | MLB Power Rankings | MLB Luck Rankings
Composition of Projections:
2024 Actuals: 48.8%
Preseason Projections: 51.2%
The Astros are 39-40, in 2nd place in the American League West, 4.5 games behind the Seattle Mariners.
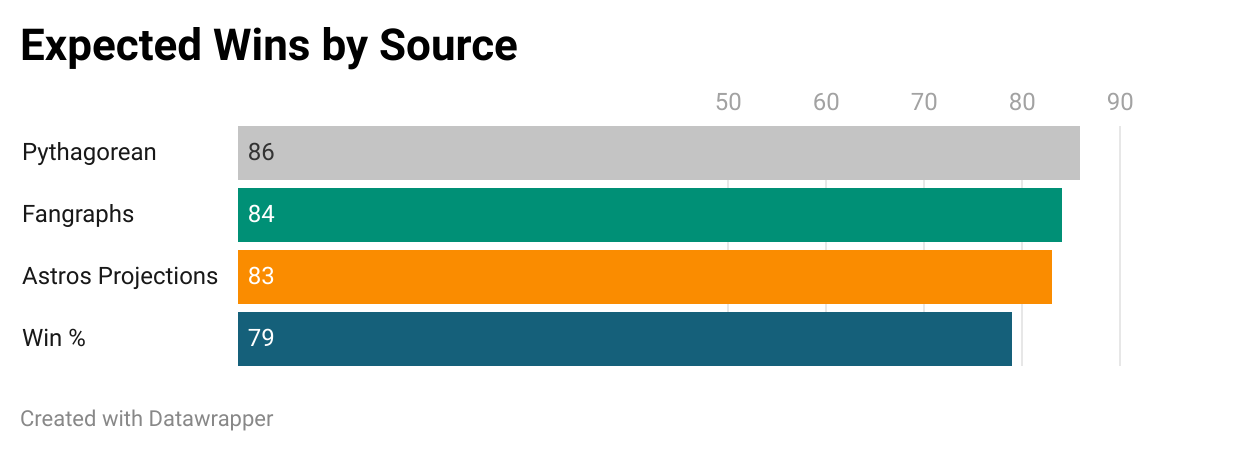
Fangraphs projects an 84-78 finish, 2nd place in the AL West, gives the Astros a 30.6% chance of winning the Division and a 48.3% chance of making the playoffs.
Podcast - Balk Off - The day my childhood friend lost a game on a balk off
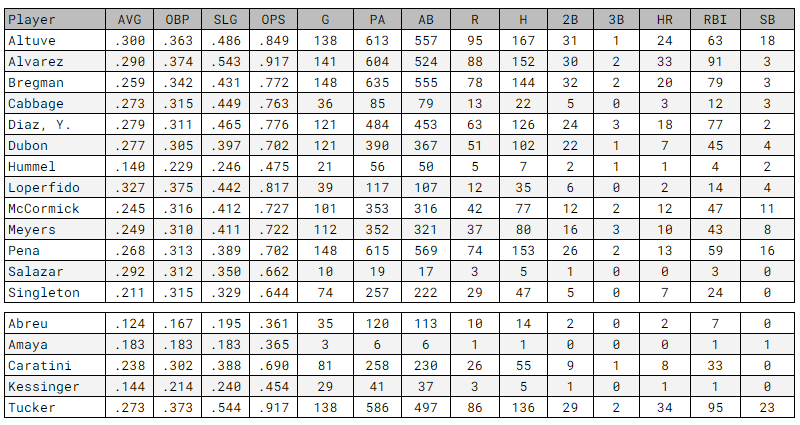
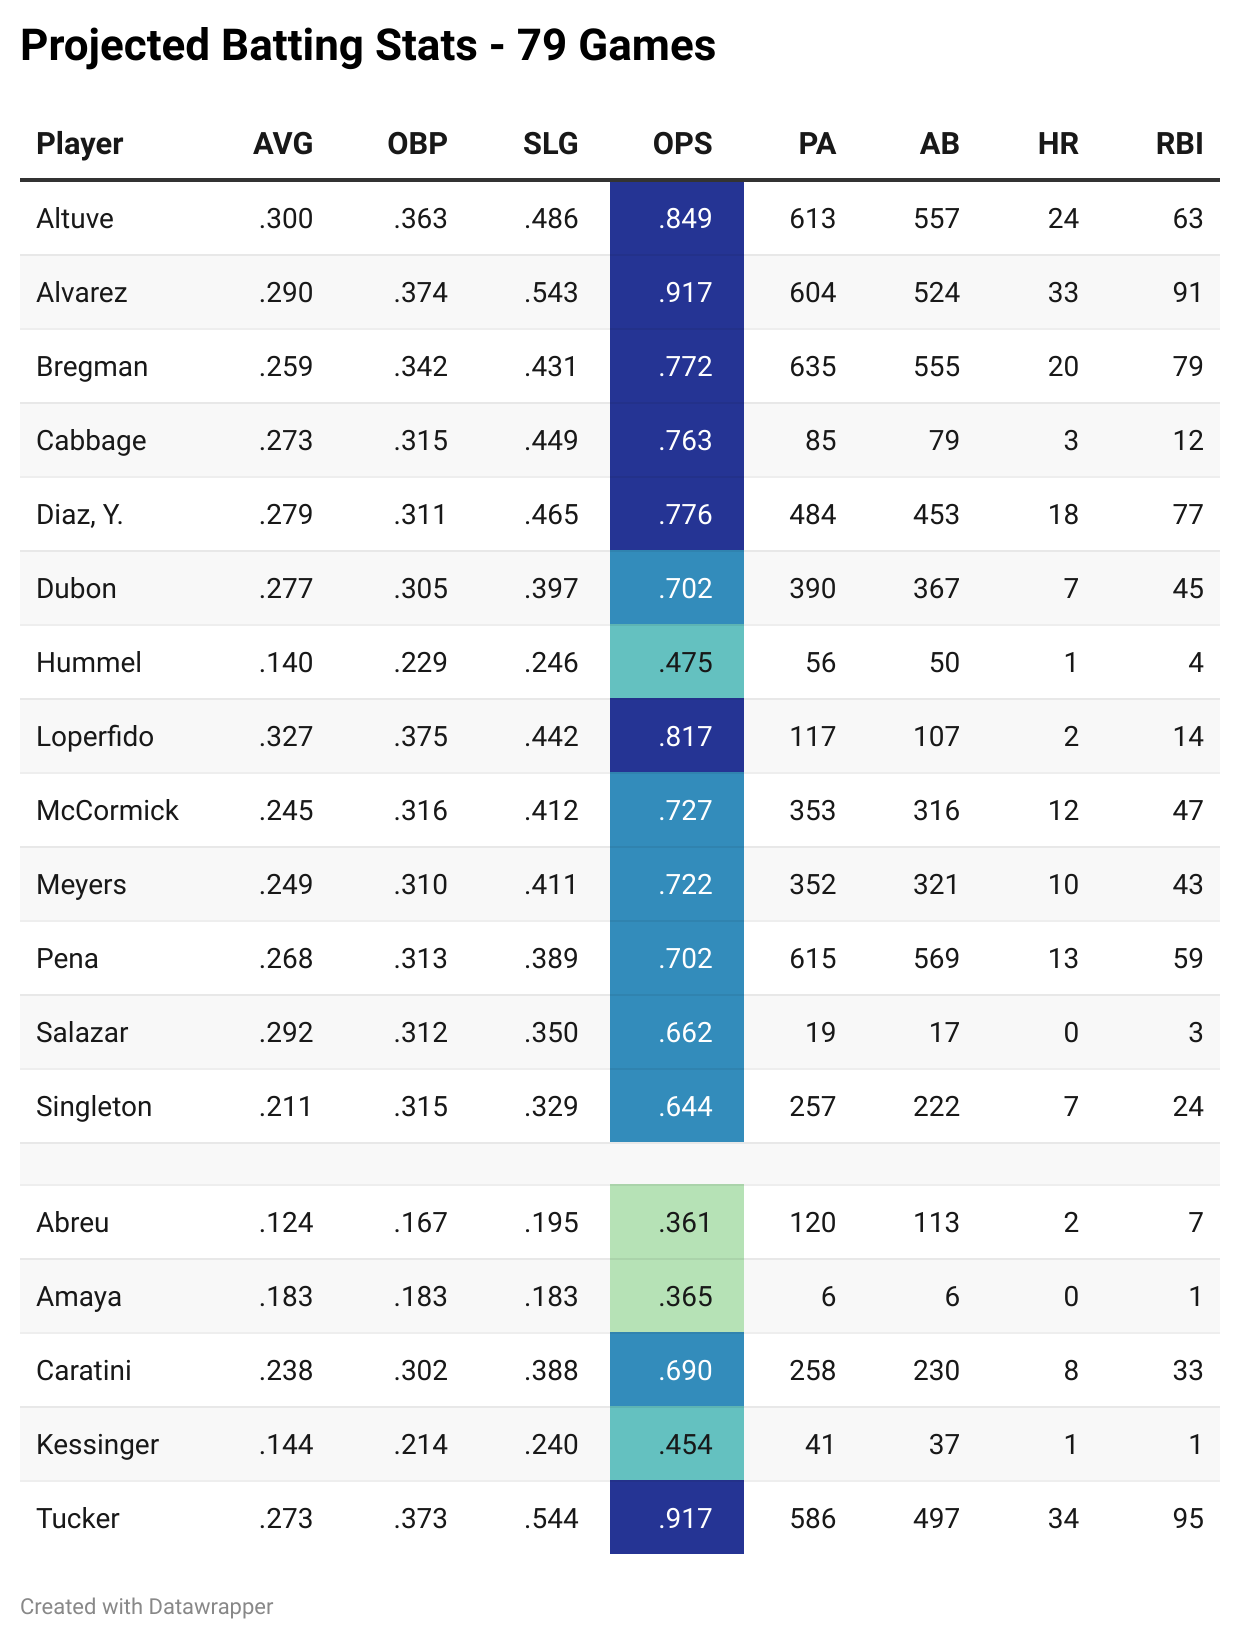
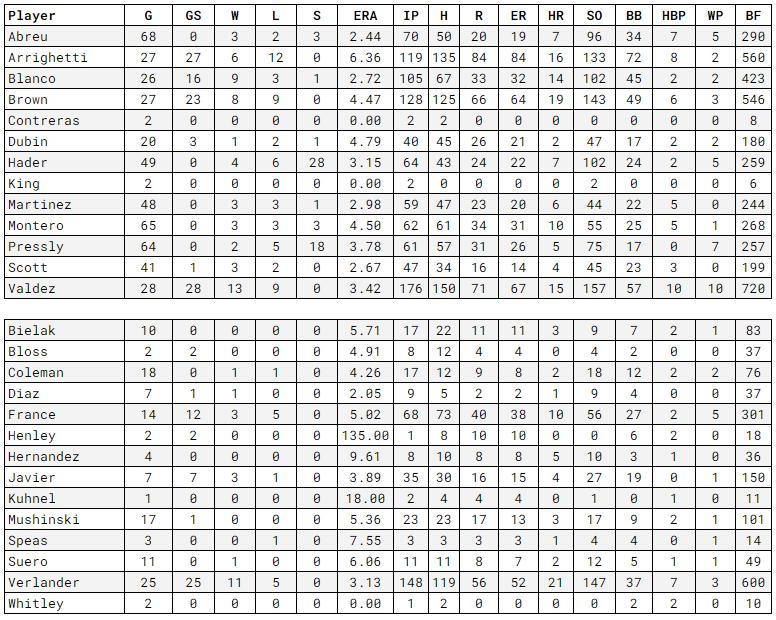
Season Projections
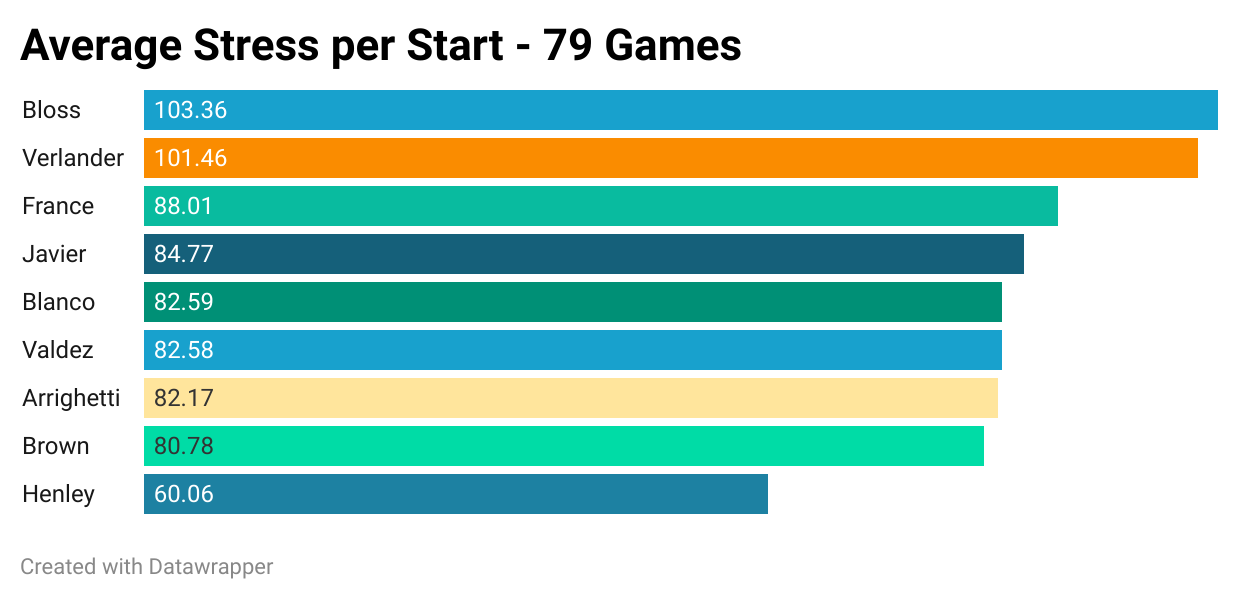
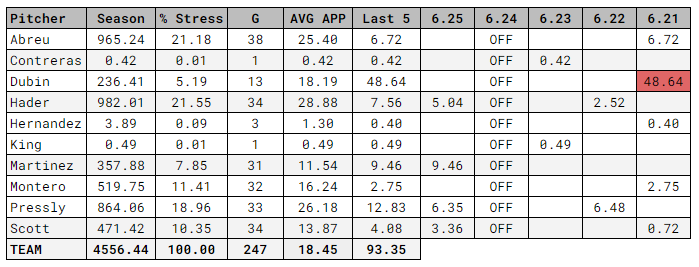
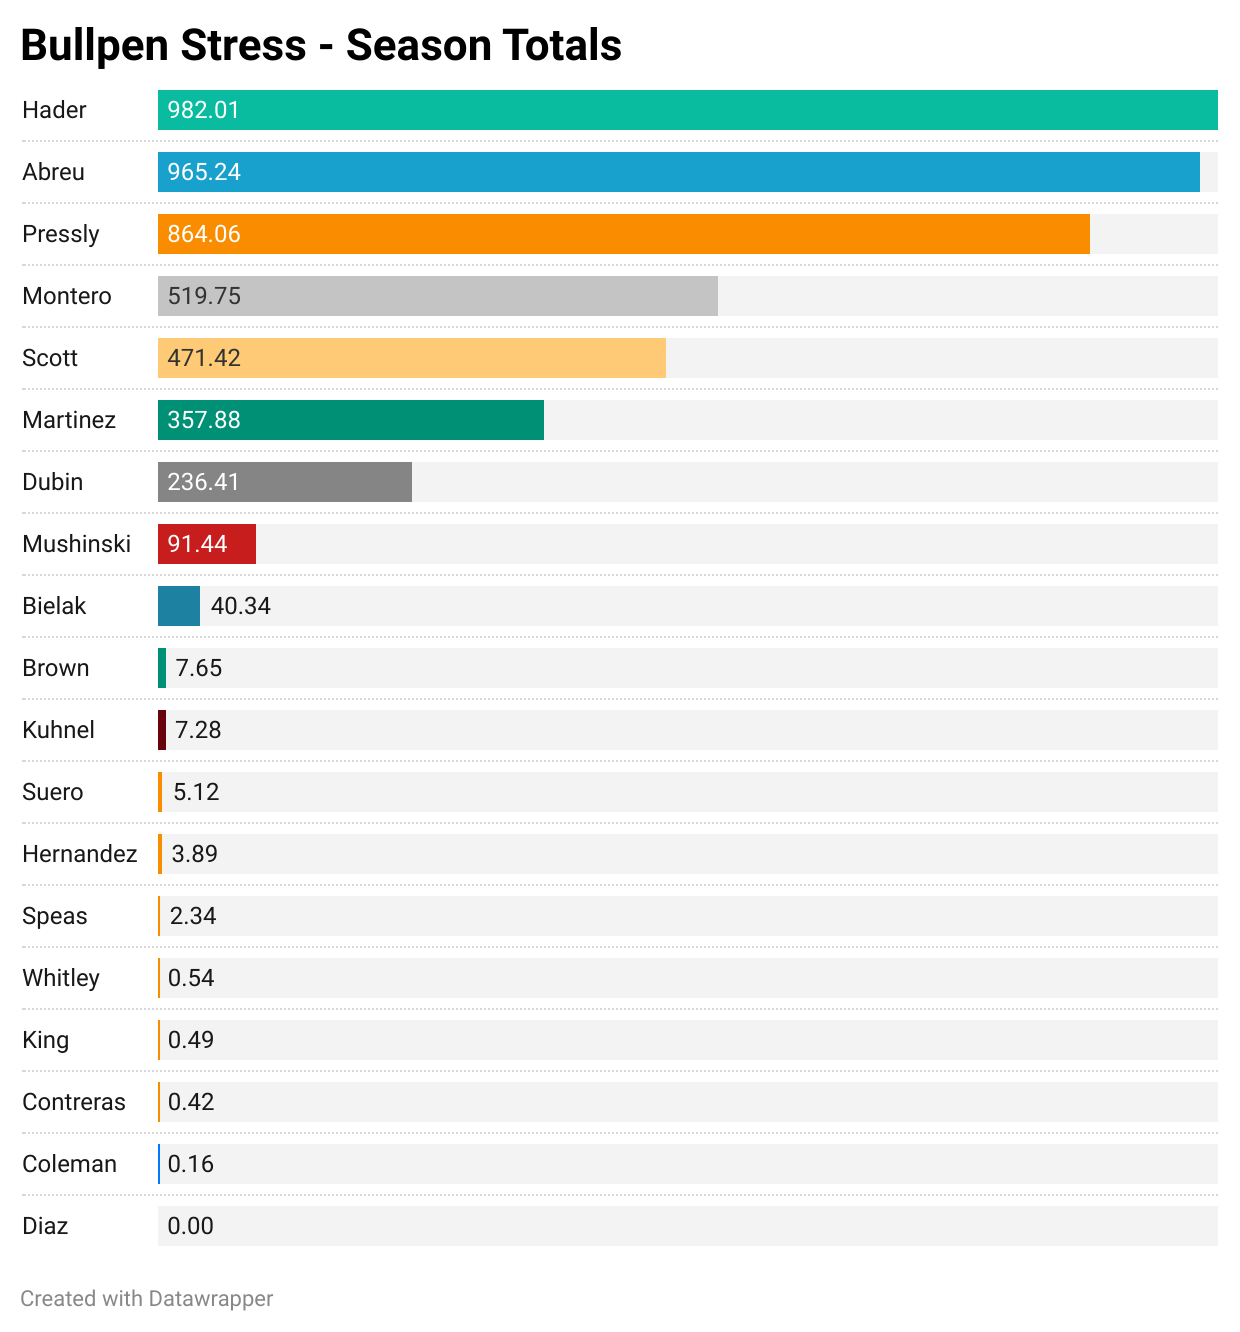
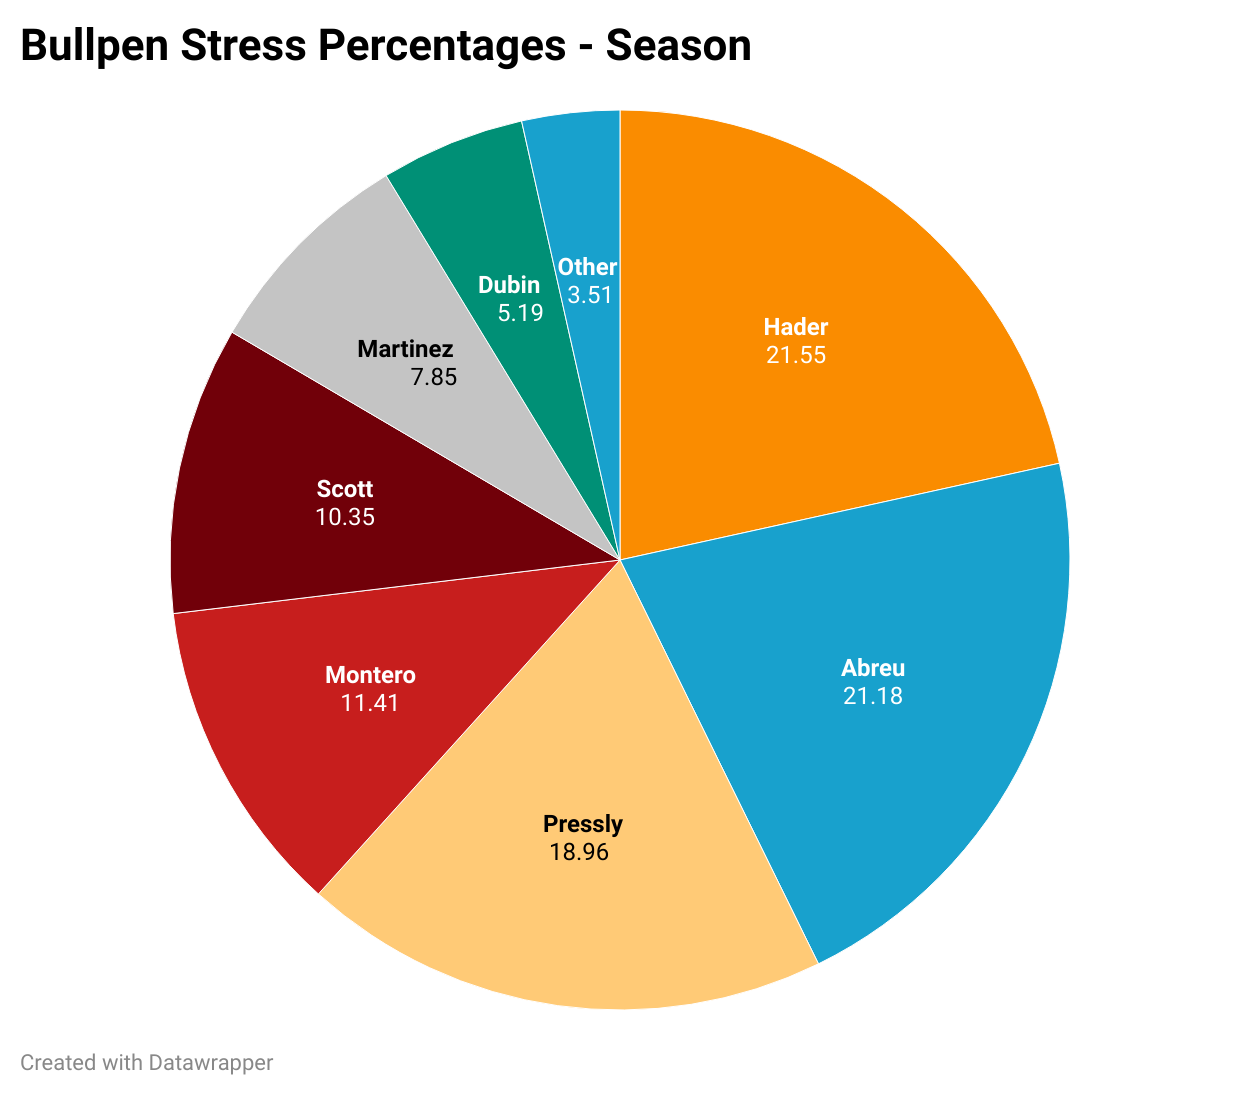
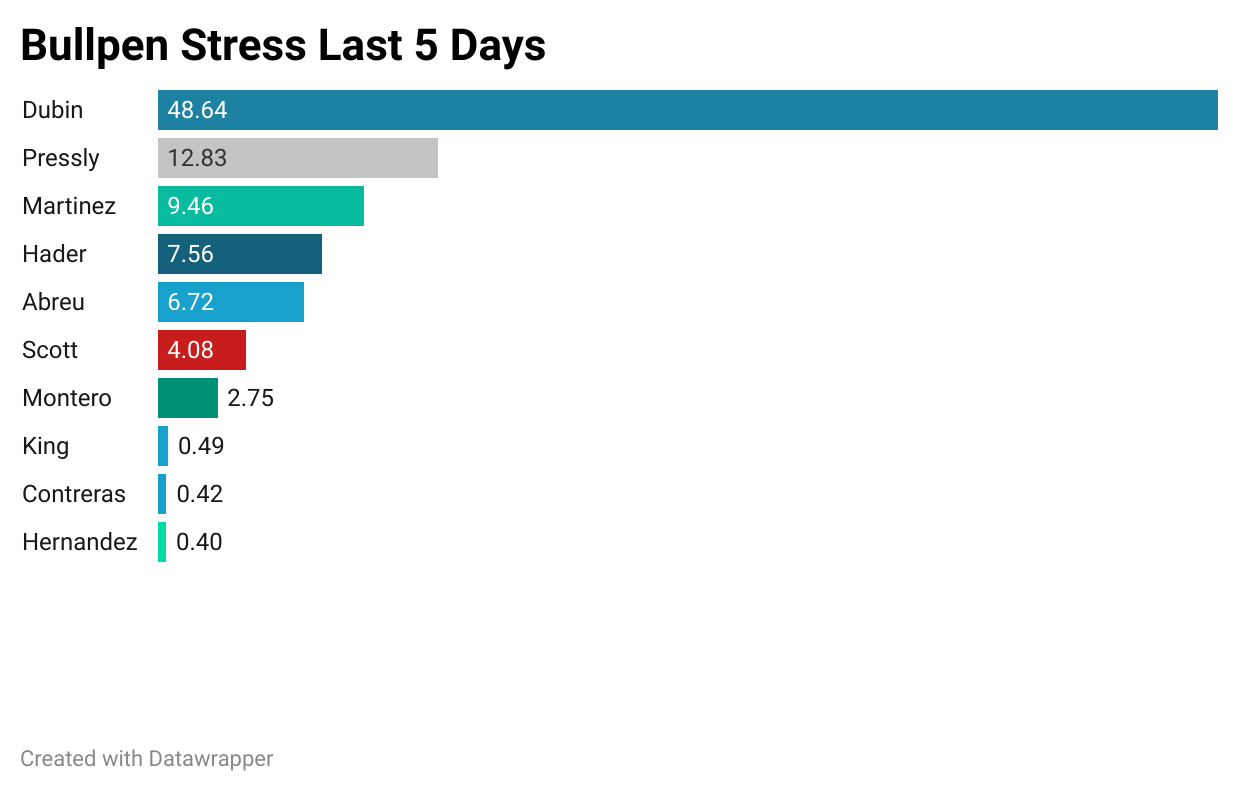
Stress Index
The goal is to capture the stress put on a pitcher, rather than just a number of pitches.
The calculation is straightforward: Number of pitches x aLI, where aLI is the average leverage index.
Biggest Play
Bottom 1, runners on 2nd and 3rd, 2 outs, 3-0 Houston. Chas McCormick singled to center (Liner). Yainer Diaz scored. Jake Meyers scored.
Astros win probability went from 81.4% to 90.3% (+8.8%).
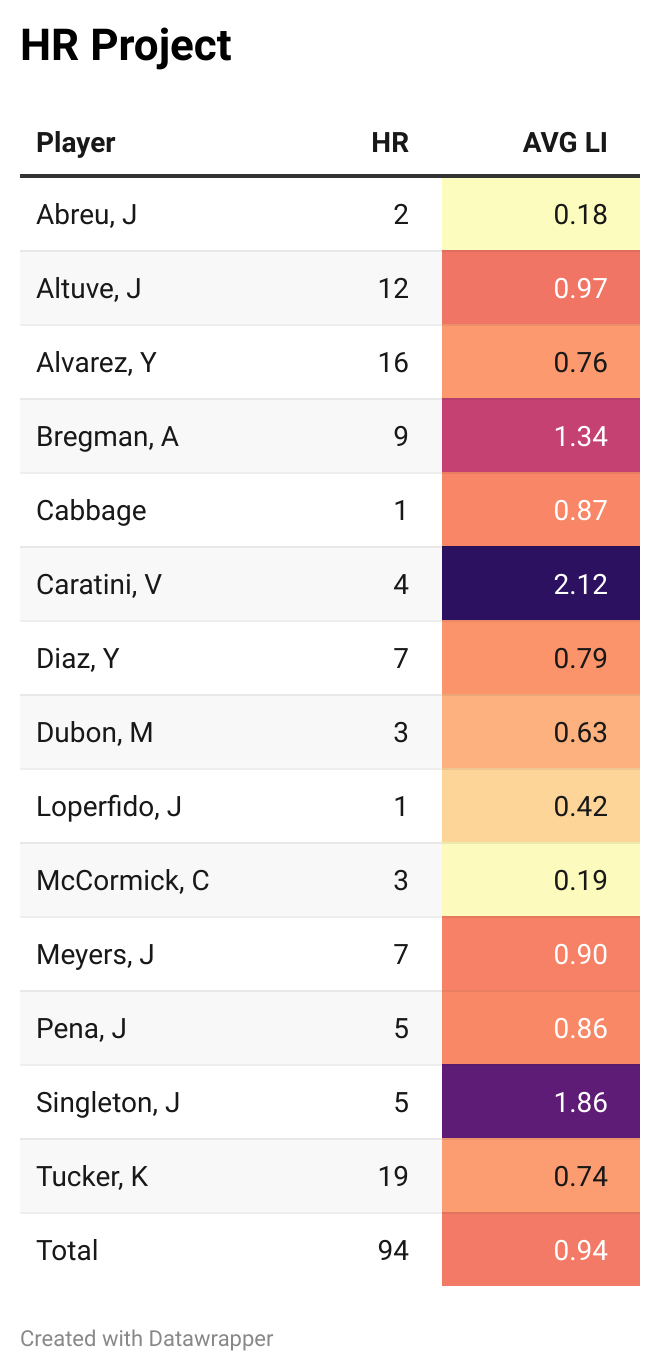
The Home Run Project
No home runs yesterday.
The Grumpy Ump is No More
Due to missing information and timeliness issues, I’ve decided to focus on the Over/Under portion of this section.
Under: 48 Over: 28 Push: 3
Under: 60.8% Over: 35.4% Push: 3.8%
Streak: 1 Under
If you want information on Umpires Scorecards please visit umpscorecards.com.
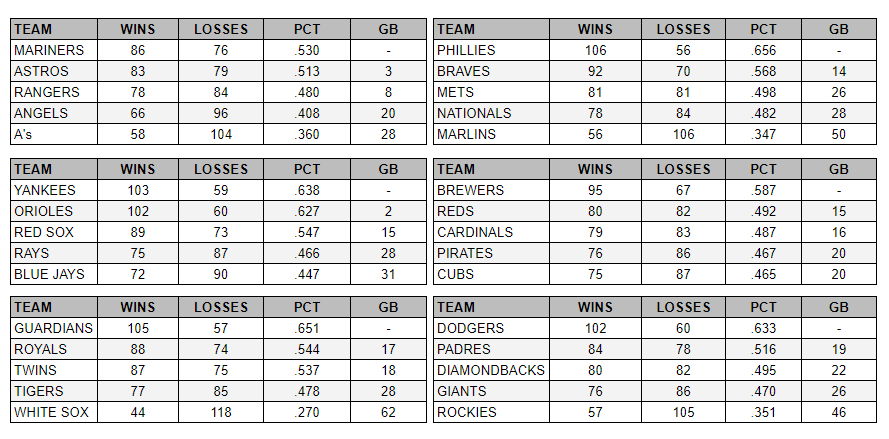
Projected Standings | Expected Wins | Luck
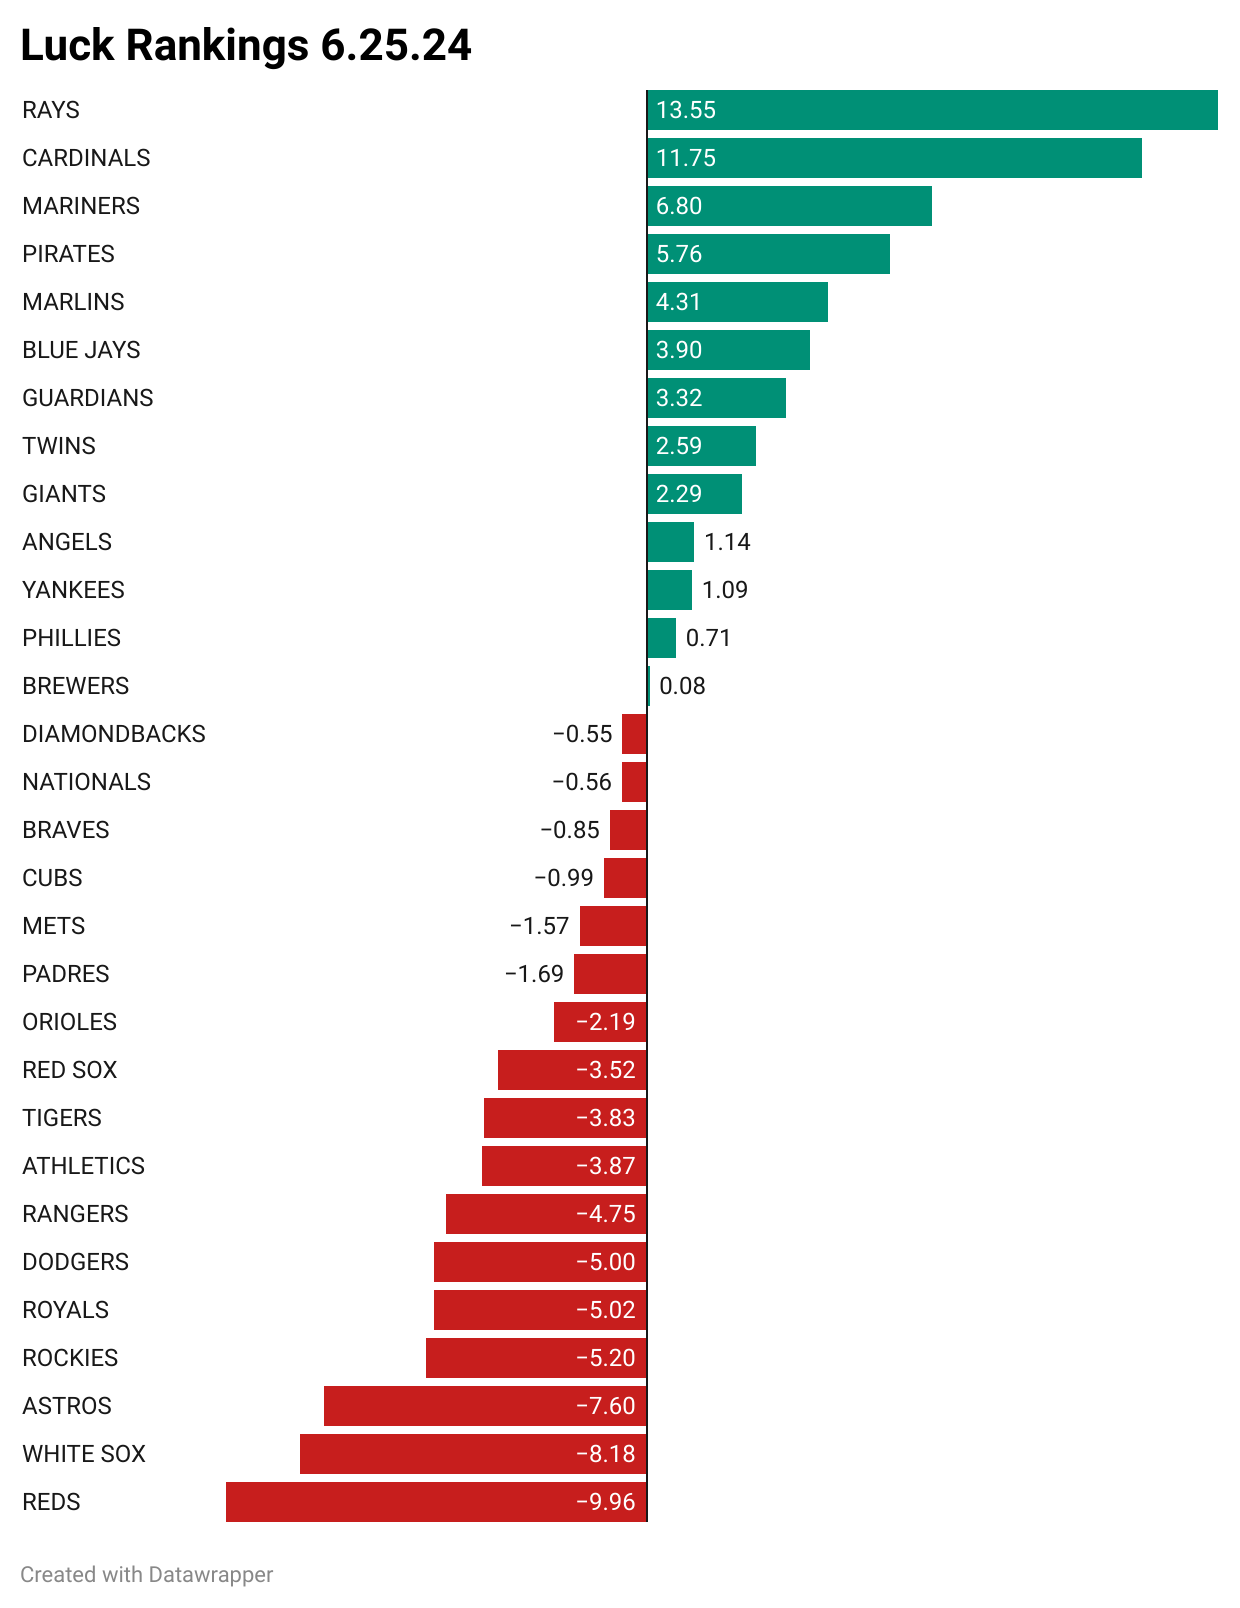
Luck Rankings
Teams at top are “luckiest”, teams at bottom are “unluckiest”.
Astros move to 28th in the Luck Rankings, implying there is still some upside in their W/L record ahead.
The Astros are 5-14 in one-run games.
The number below is the percentage of a team’s winning percentage that can be attributed to “luck”, either positive (green) or negative (red).
Example: At one point the Astros win % was .439 and my numbers say they “should” have been at .493, a difference of .054.
.054/.439 = 12.3% (rounded), which was the Astros luck rating, which was negative in this example.
In general, you expect the teams at bottom to regress positively (towards 0.00) and teams at top to regress negatively (to 0.00).
Stat(s) of the Day
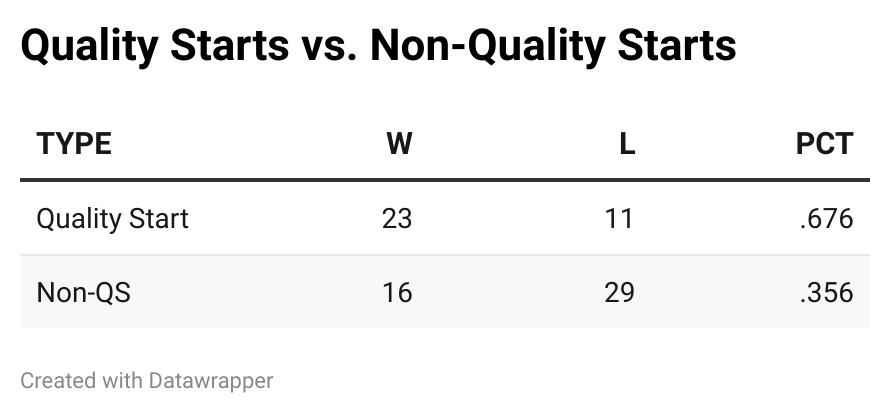
Quality Starts
Across the league teams win close to 70% of games where their team’s starter throws a quality start.
It is closer to 80% if your pitcher has a quality start and the other team’s pitcher does not throw a quality start.
Simply put, it’s indicative of “keeping your team in the game”.
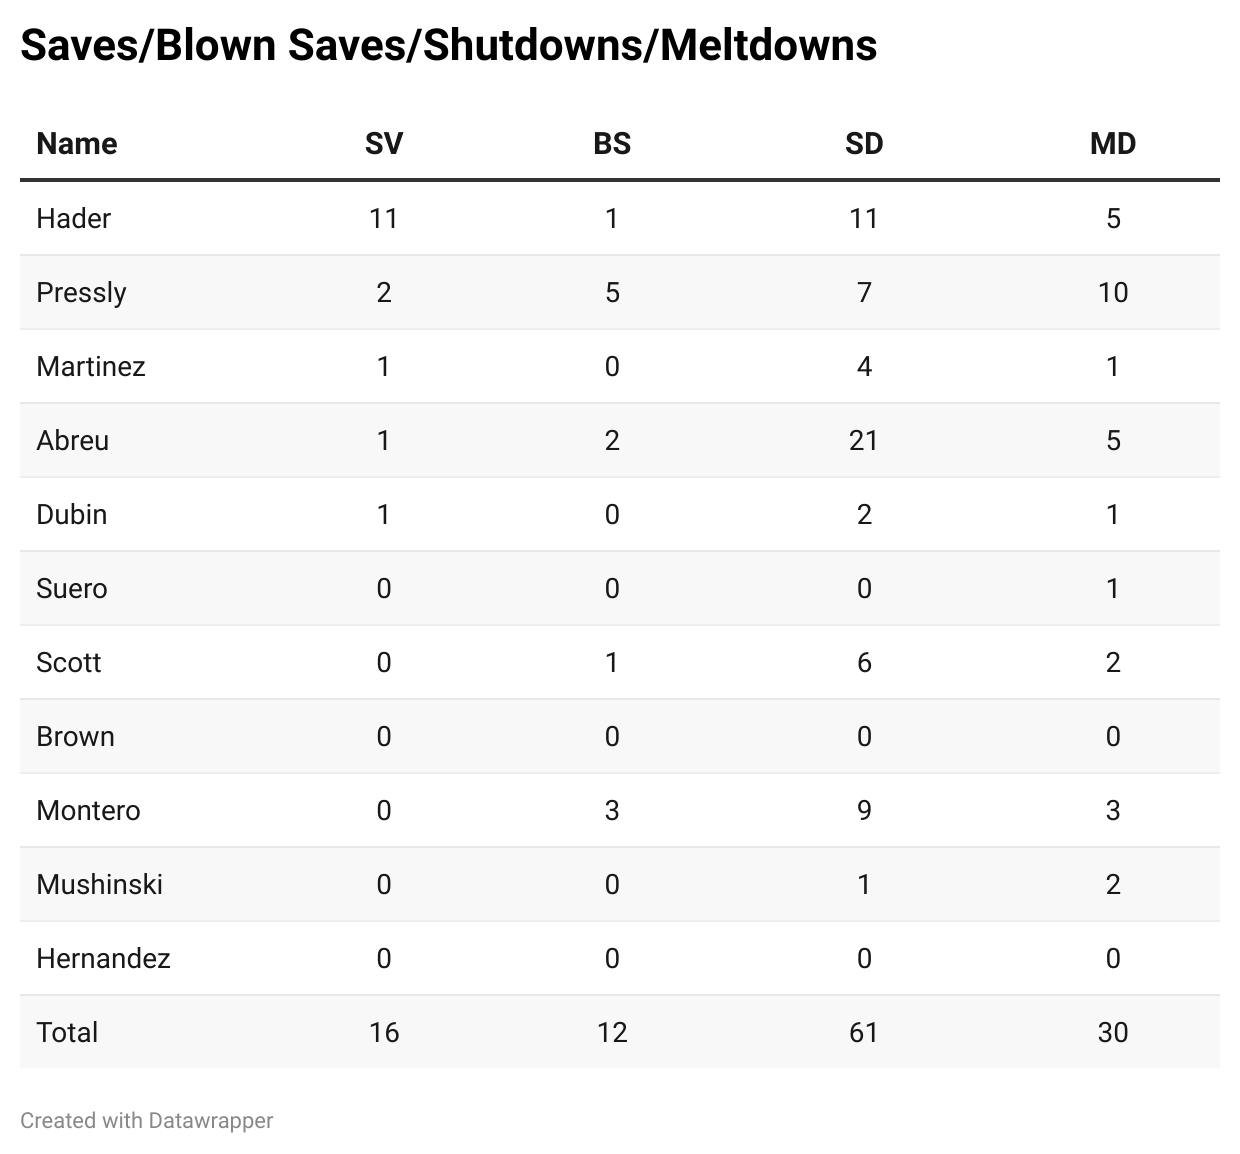
Saves and Such
Everyone knows saves and blown saves. Shutdowns and Meltdowns are a Fangraphs stat that I find very useful.
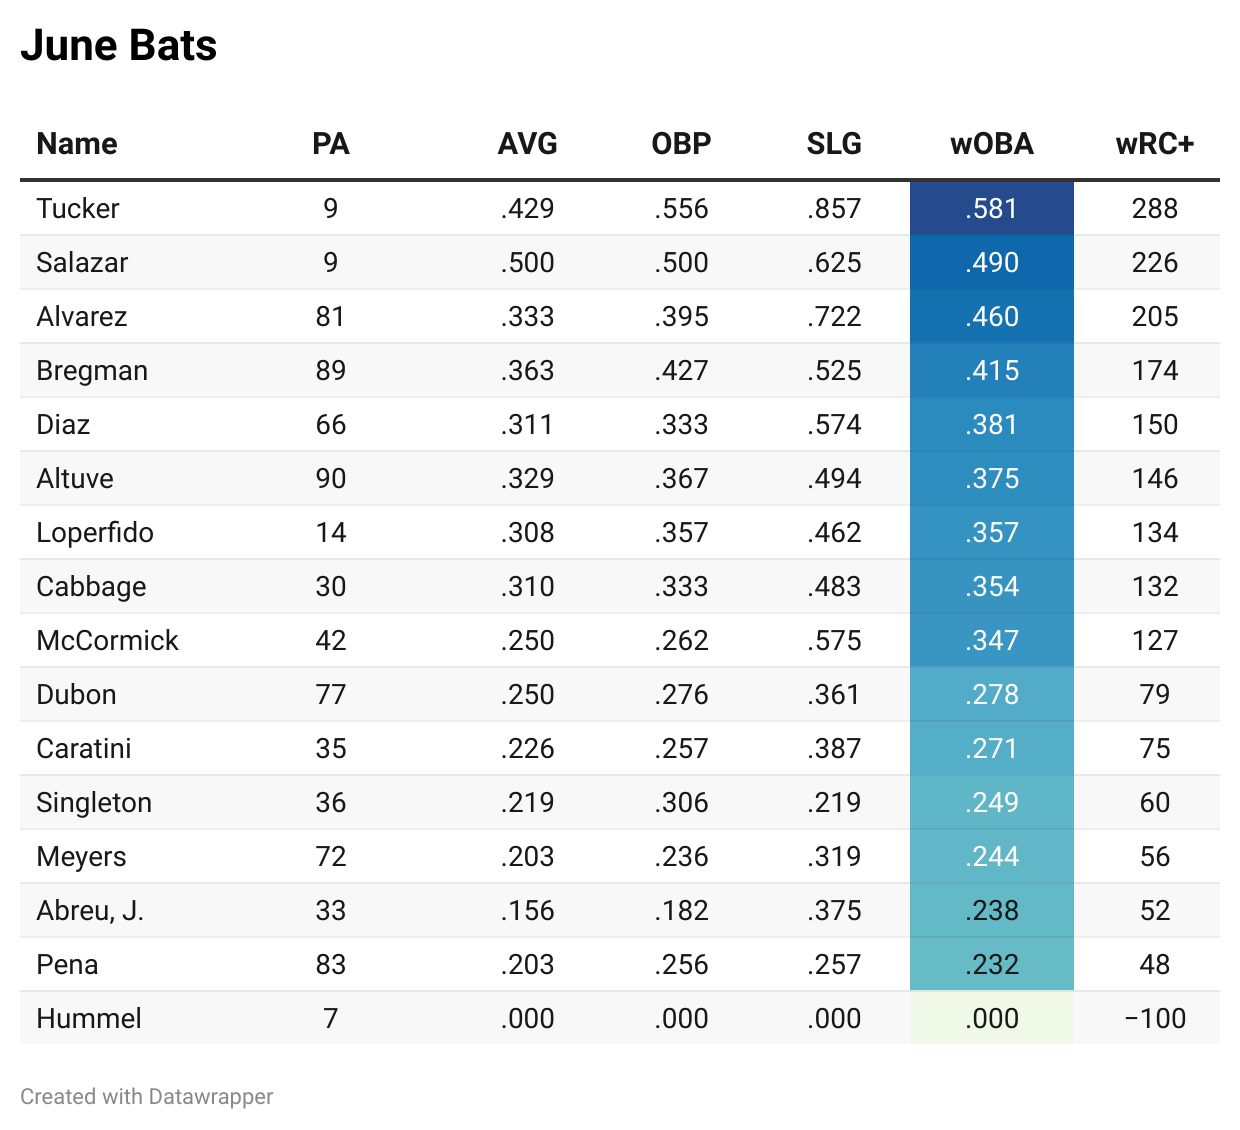
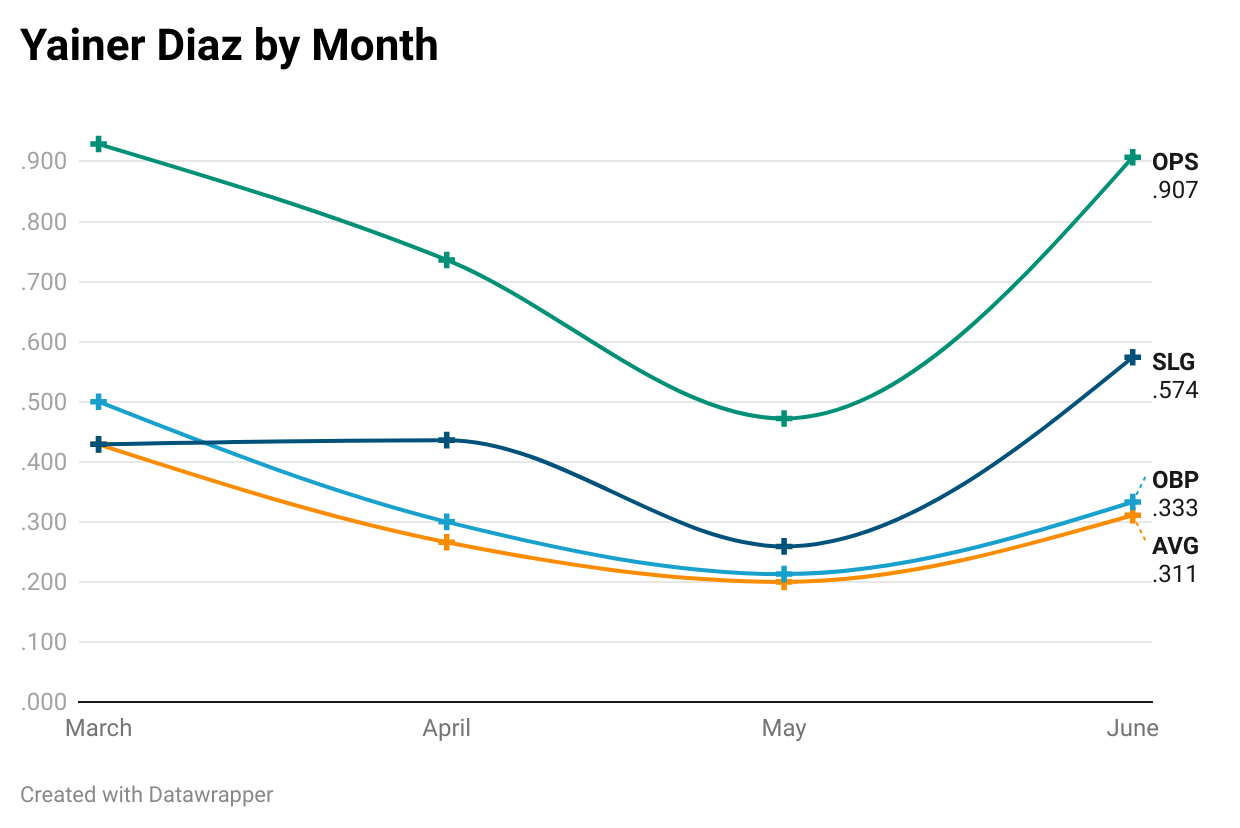
Bats in June
Yainer Diaz by Month
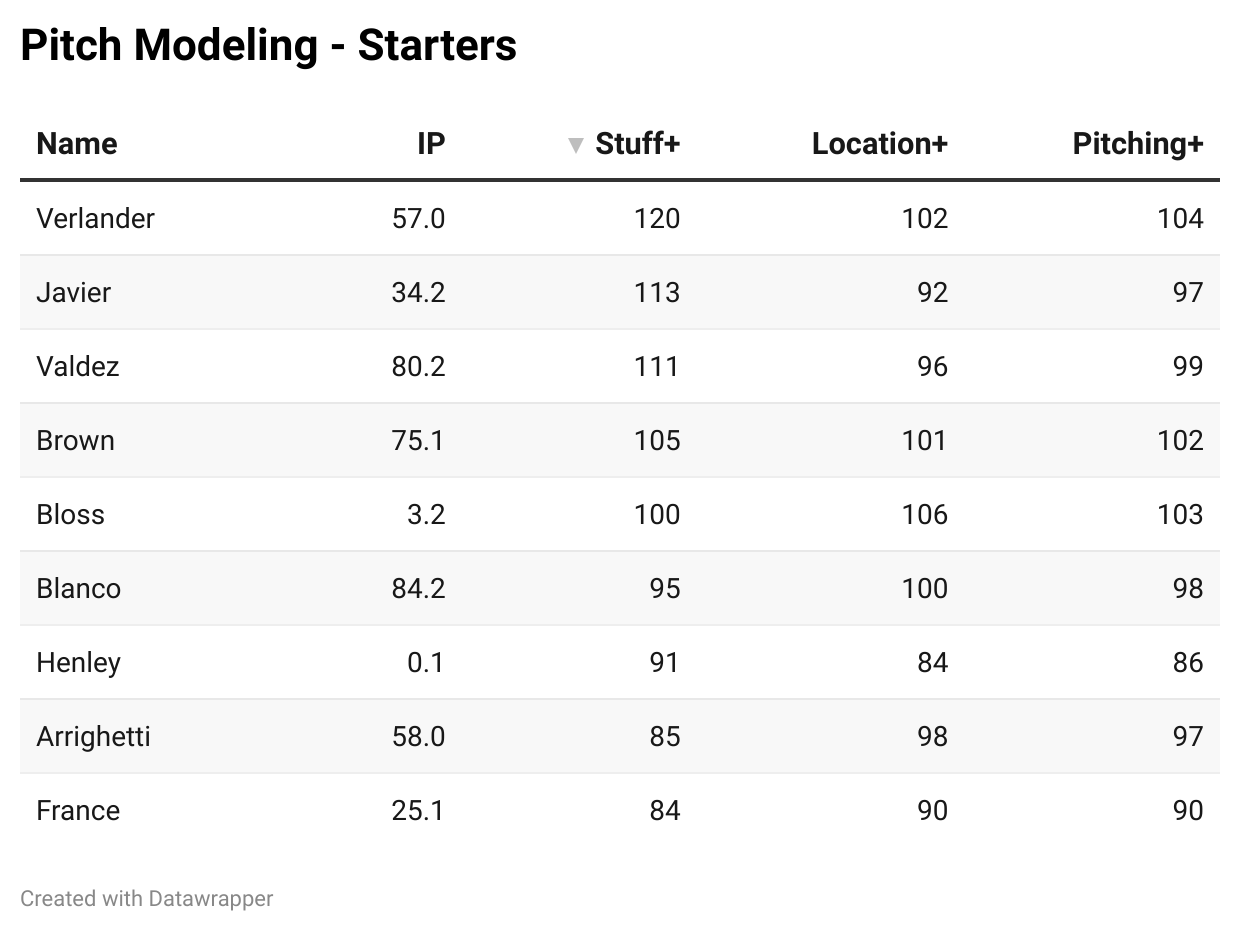
Pitch Modeling - Starters
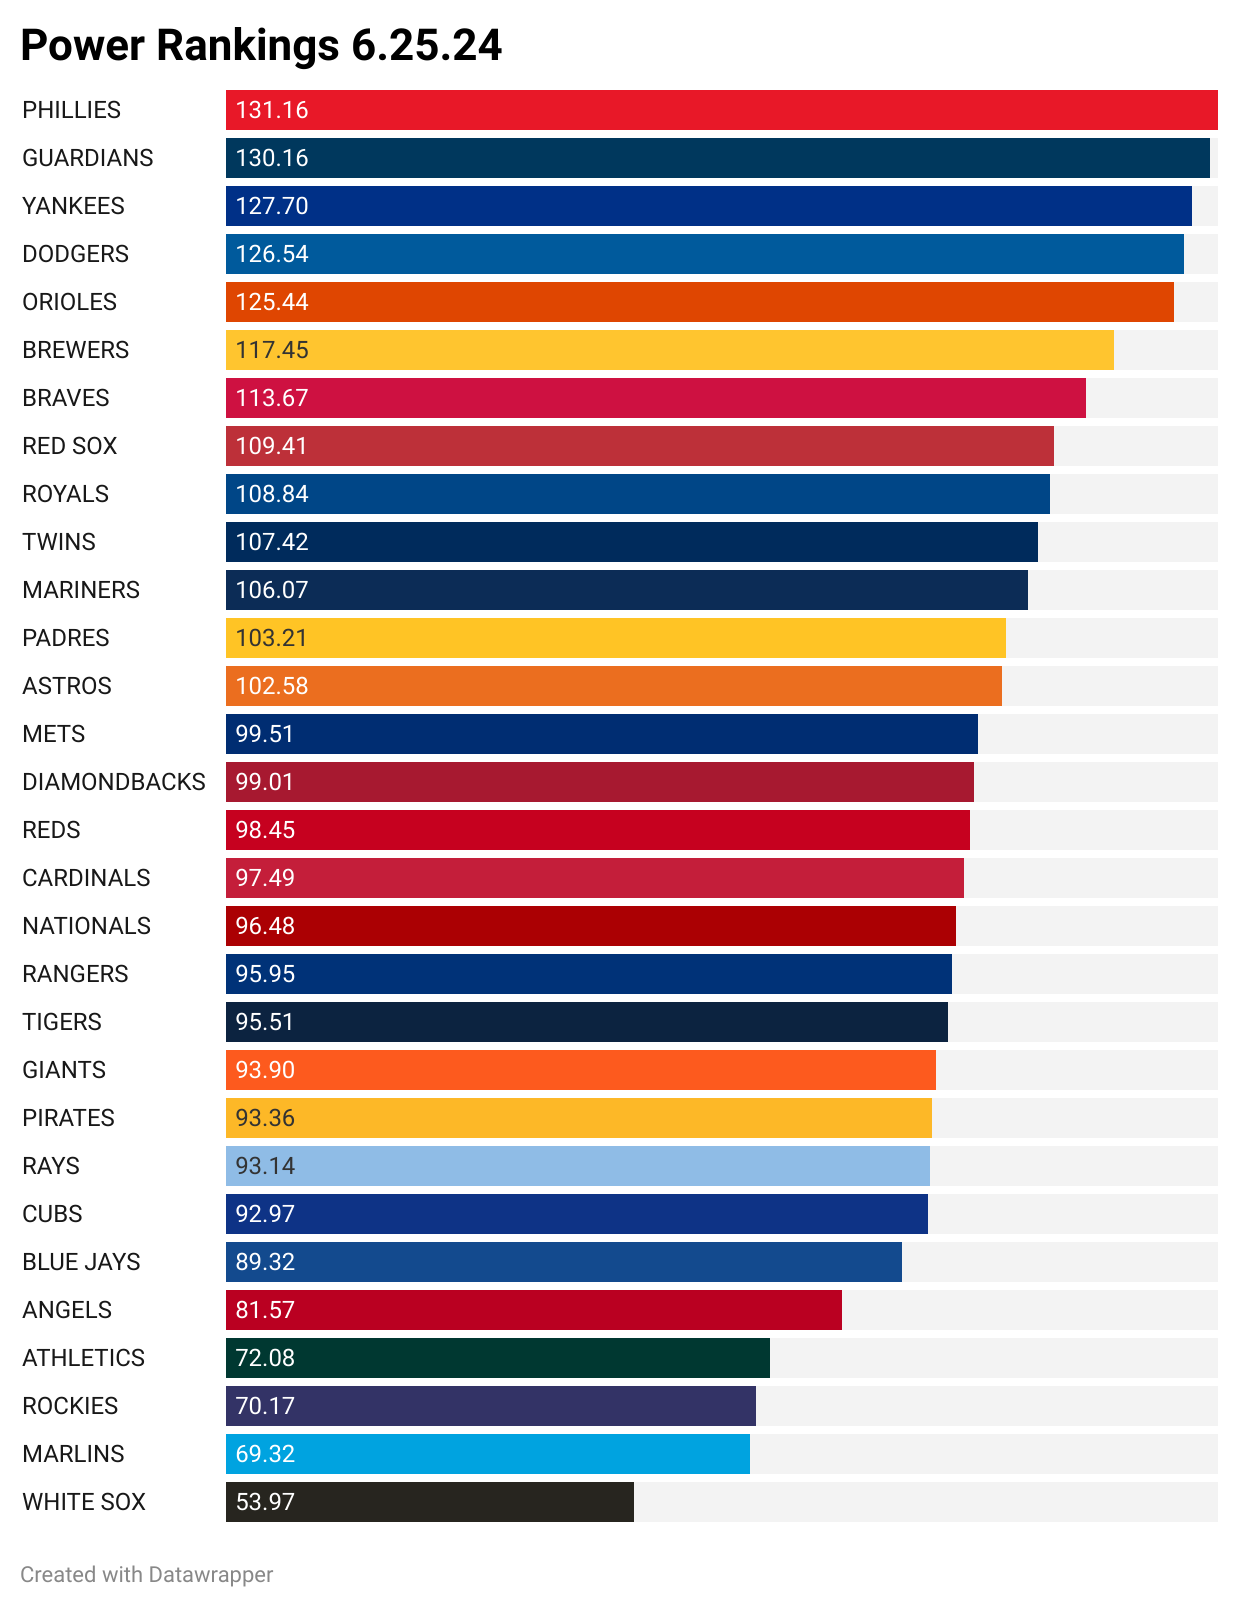
MLB Power Rankings
On a scale where 100.00 = 81 wins. In other words, a power number of 110.00 means you would be expected to win 110% of the “average team” (81 wins) which equals 89 games.
These rankings consider runs scored, runs given up AND wins and losses.
50.00 = 40.50 wins
75.00 = 60.75 wins
100.00 = 81.00 wins
125.00 = 101.25 wins
Thank you for reading.


